Salesforce - Tableau Mobile
Data Guide: Optimizing a web feature for mobile

Overview
Data Guide
A new feature on Tableau that enables users to gain additional information on shared dashboards in order to understand how to use or interpret the data in it.
Orientation helps onboard new and existing Tableau users who look at a Viz for the first time and helps users who check a Viz infrequently remember why this matters and who to go to for follow-up questions..
Problem
While Data Guide offers great value to desktop users, the absence of this feature on the mobile app means that mobile users are currently left to fend for themselves when seeking additional information relating to the dashboards they are looking at.
Info
Role
UX Designer
Duration
12 weeks
Type
Mobile App
Collaborators
Product Manager
UX Design Manager
Phoenix Dev Team
Solution
I redesigned and optimized the web version of data guide to make this feature available to mobile/tablet users and create the best experience for them.


Target Users
Who Needs This & Why?
Those acting in business roles, specifically the information explorer and director whose needs are around sense-making.
Tableau Business Users


User Goals

Business Goals
Why is it necessary to optimize data guide for mobile?
Efforts to improve functionality across devices
Have Information and updates regarding dashboards on the go
Design Goals/ Principles
What design principles can I follow to provide the best experience for mobile/tablet users?

Smart Default mode
Enable users make side by side comparison of information

Progressive Disclosure
Prioritize the most important information relating to the context users are seeking

Readily accessible
Data guide should be accessible by business users at every level of selection

Easy & Memorable Patterns
Discoverable for first-time users with a memorable pattern for returning users.
Research
Research happened in two phases

Data Guide shows three levels of information

Representing the Information

Why I chose the bottom pane:
Default Smart: Provides Easy comparison
Progressive Disclosure: Shows most relevant information first
Easily Accessible
Recognizable mobile pattern
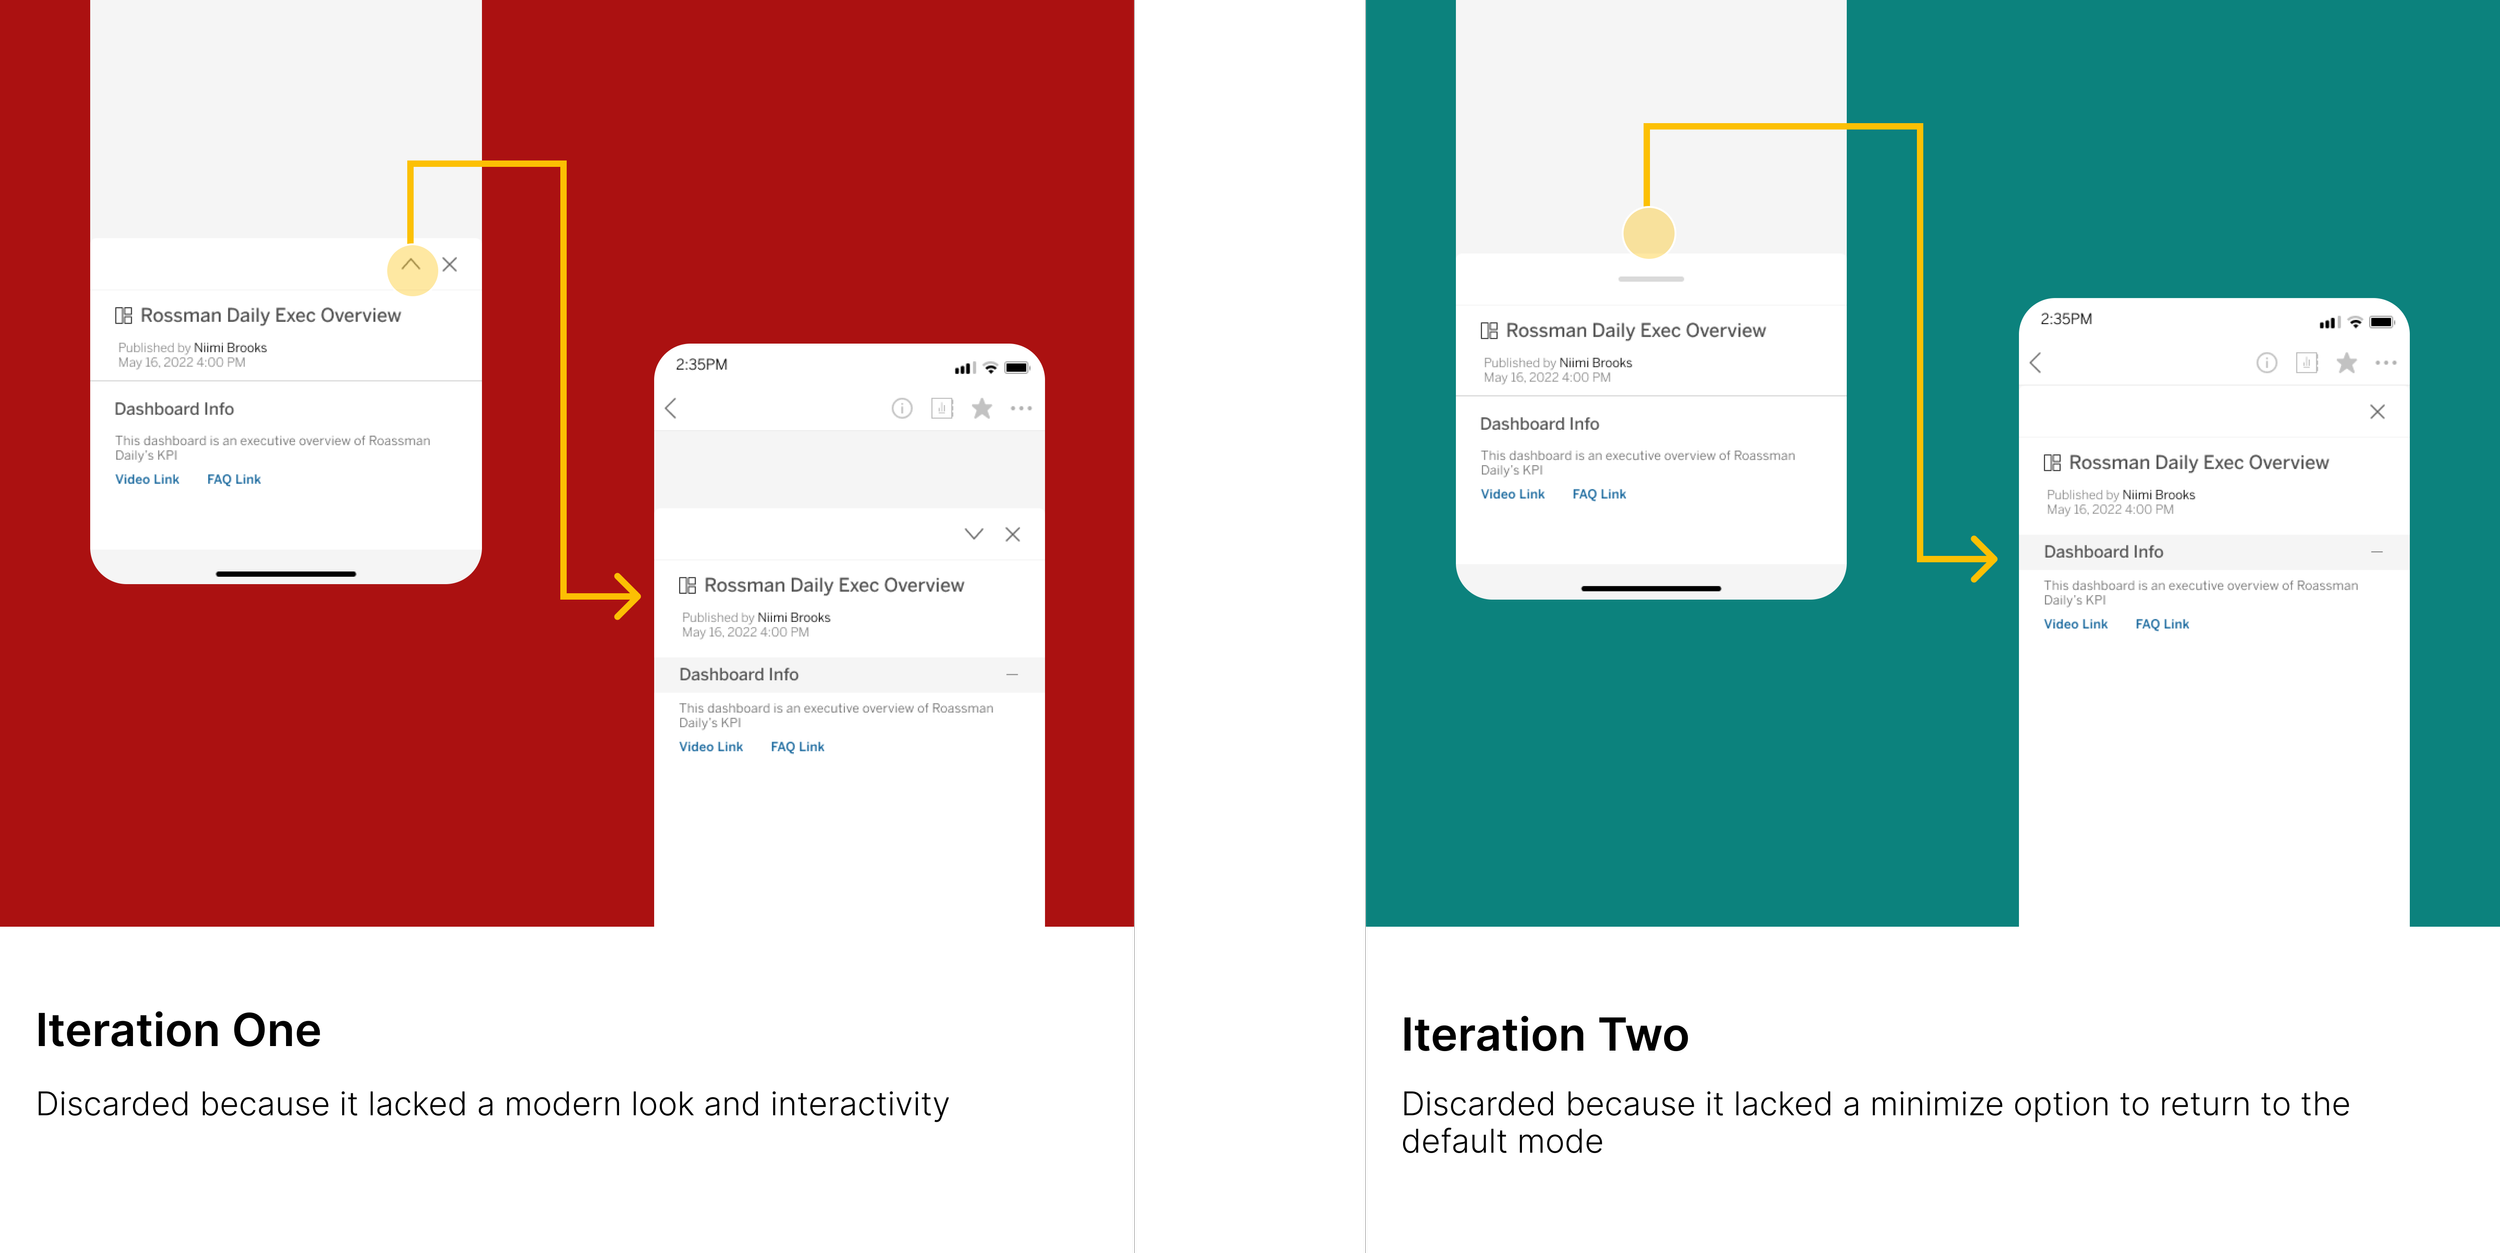
Pane Interaction
Entry Point
How do I incorporate this new feature into the existing flow of tableau mobile?
Accessing the Dashboard Info

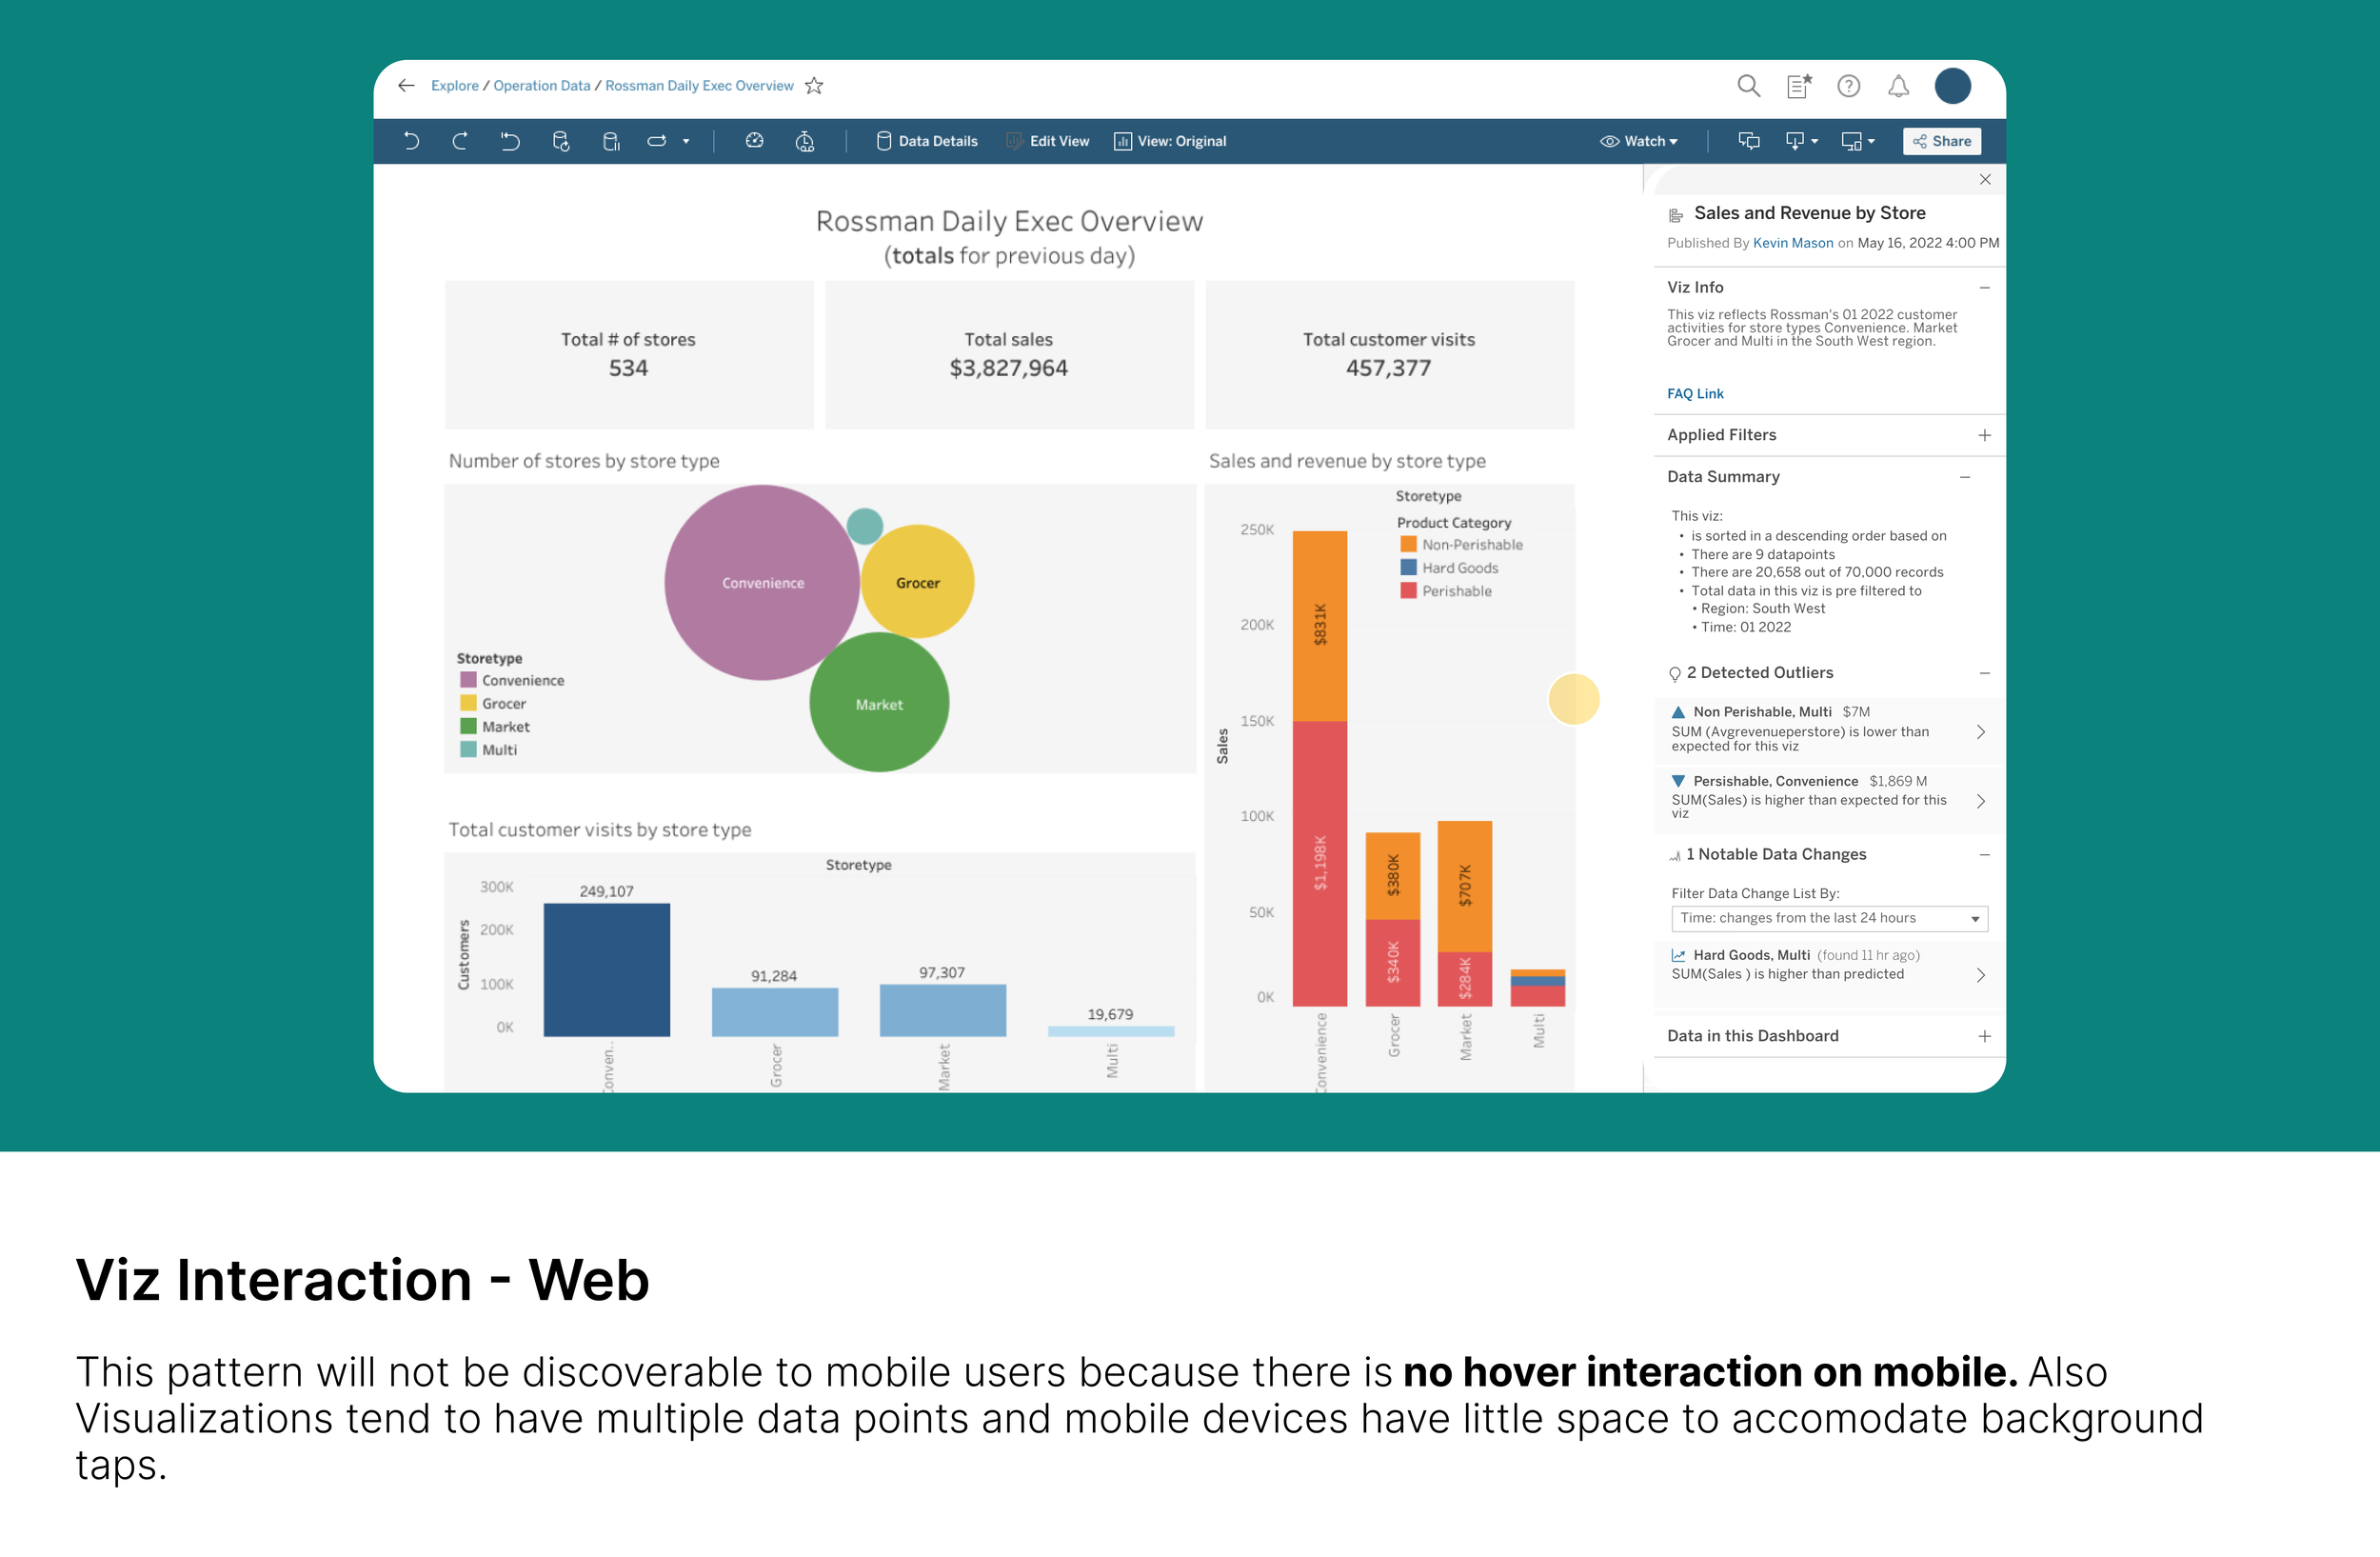
Accessing the Mark Info

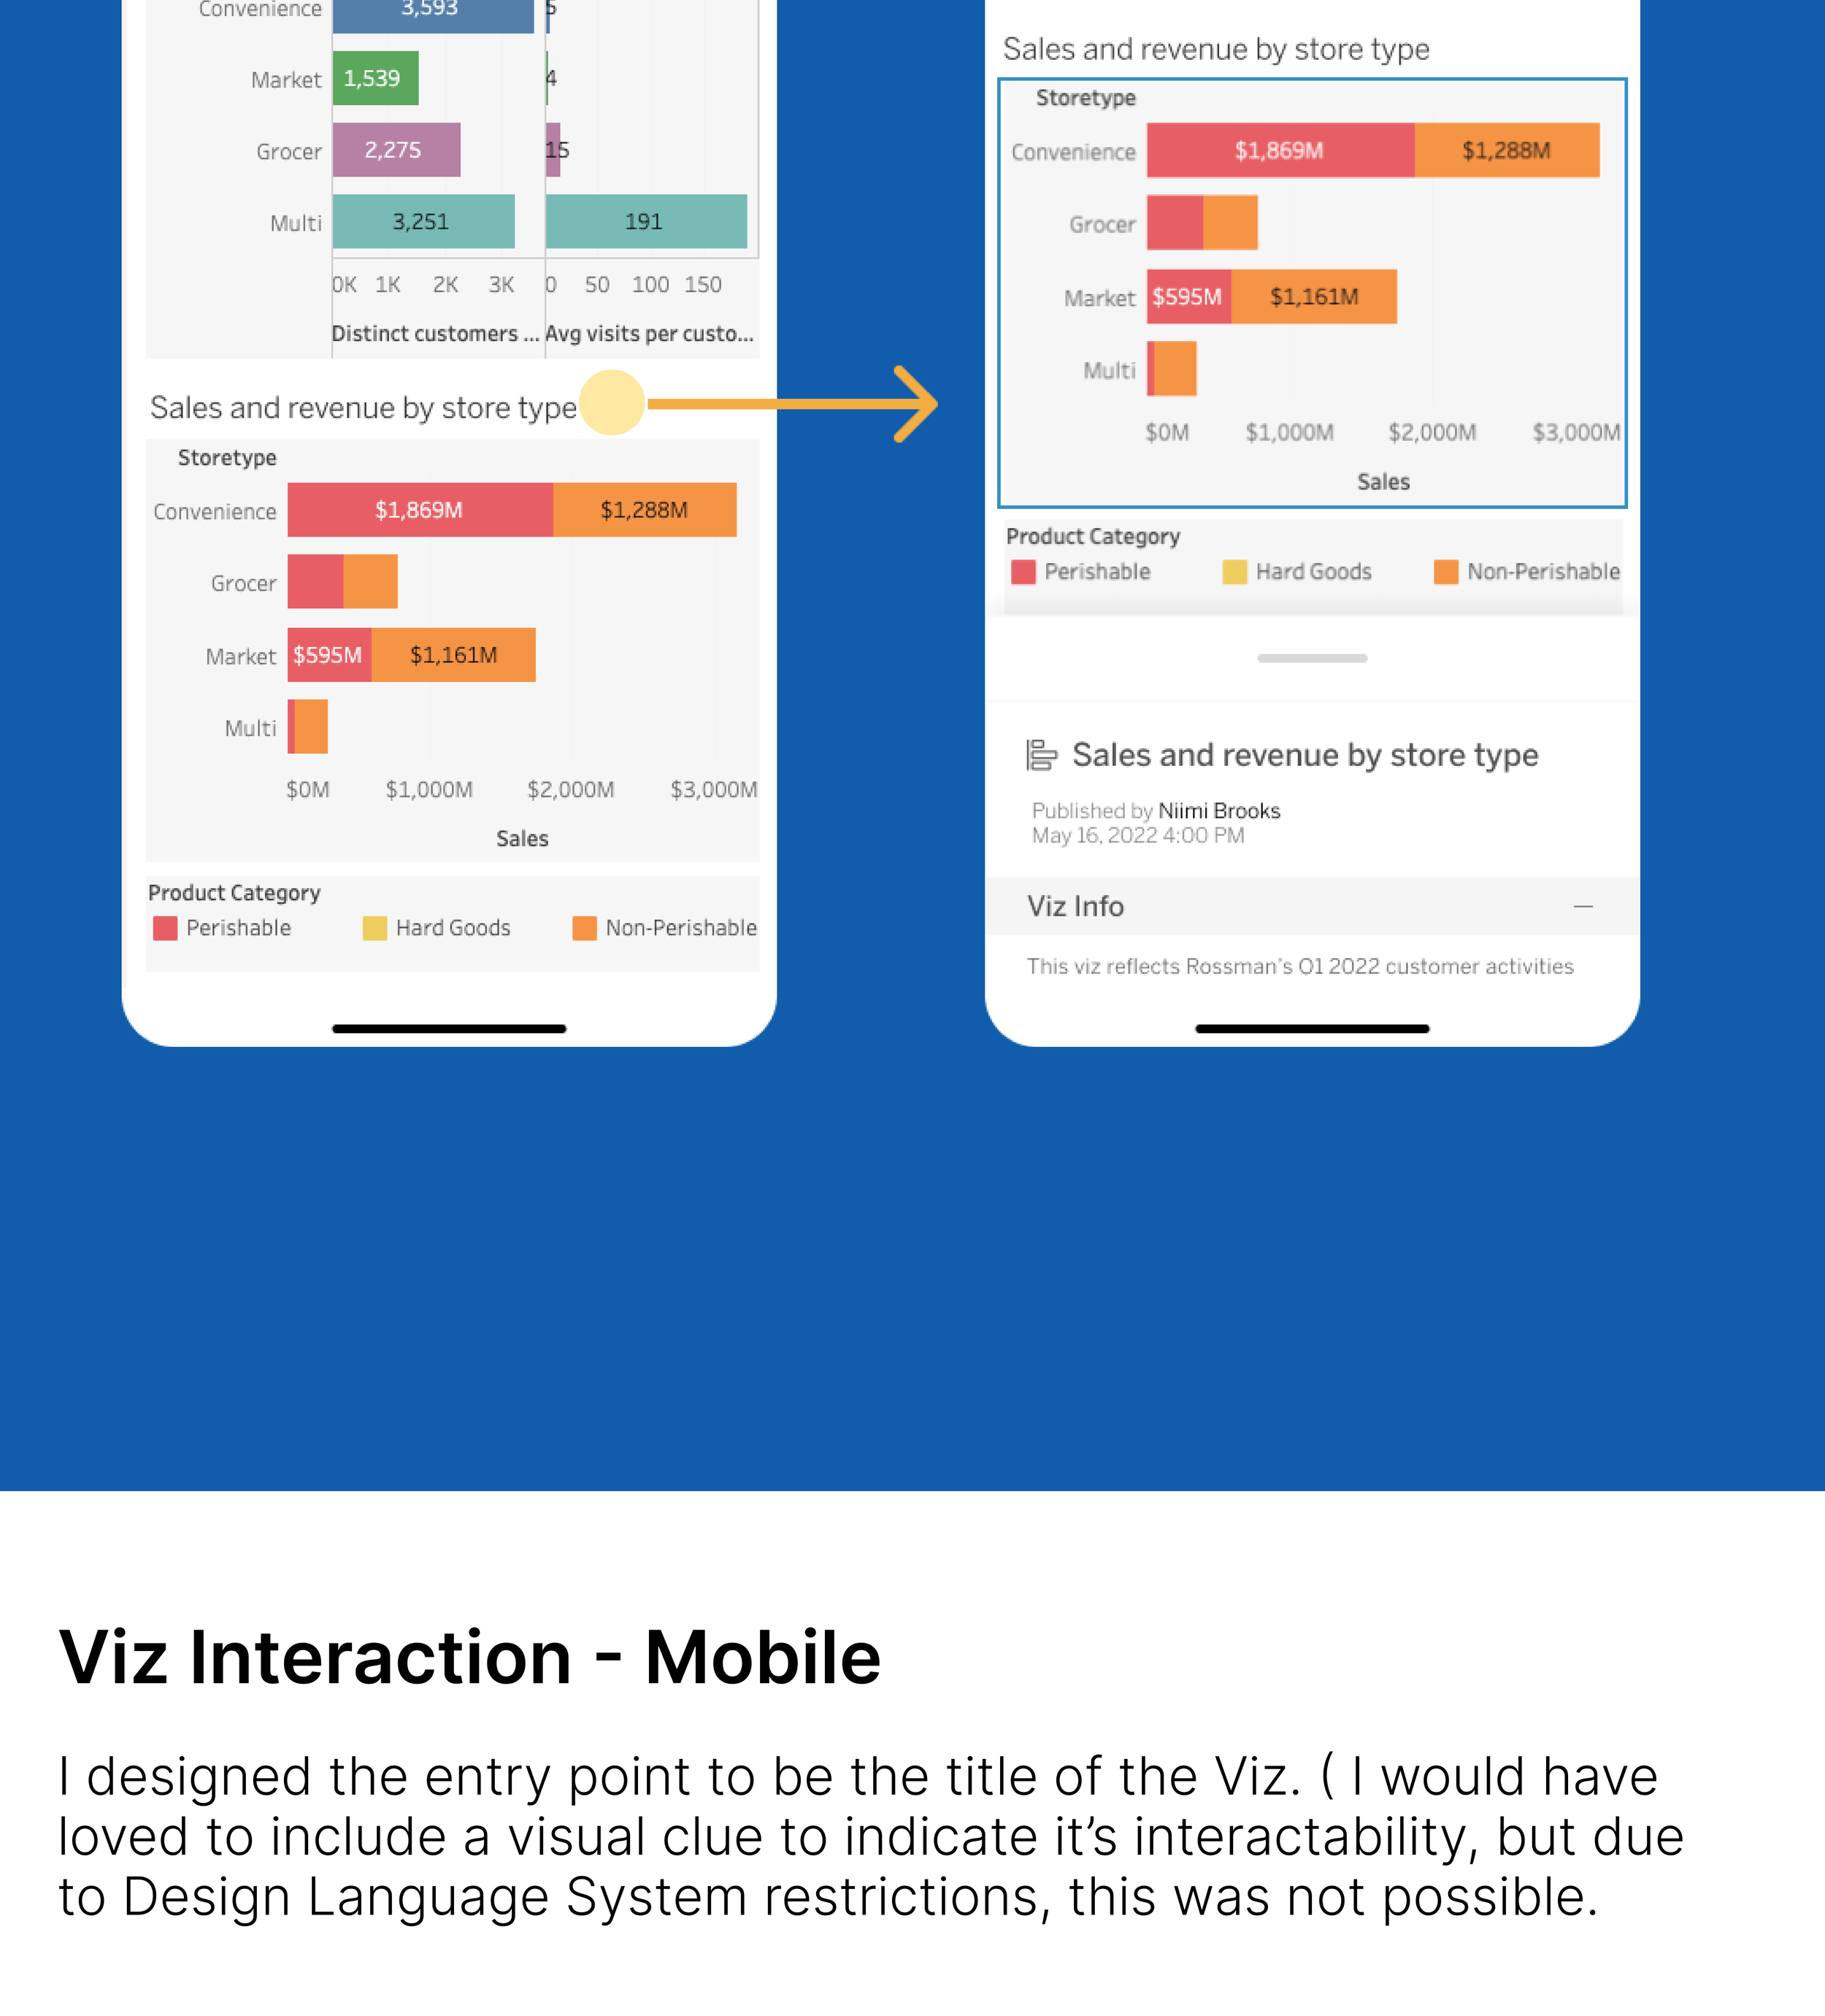
Accessing the Viz Info
Landscape Mode
Both iterations had their pros and cons design wise. Whichever will be adopted depended on the reason our user’s utilized landscape mode
User Testing
Goal
I wanted to know if users found the entry points discoverable
And gather feedback on the usability and information hierarchy of data guide
Method
How may I structure my interviews to achieve this?
In collaboration with Research experts at Tableau, I conducted 3 moderated usability test sessions both in person and online with current tableau users. They were asked to walk through the app and assigned tasks to see if they found the entry points discoverable.
Test Participants

Tasks
1. Accessing Dashboard Info: “Tell me…How would you seek more information about the dashboard - Rossman’s Daily Exec Overview” Do you know who published this dashboard and when?
2. Accessing Viz Info: “Tell me…Are there any filters on the Viz ‘Sales & Revenue by store type’ “
3. Accessing Mark Info: “ Tell me…What’s the average revenue for non-perishable goods under the ‘multi’ store type? “
Interview/Testing Results
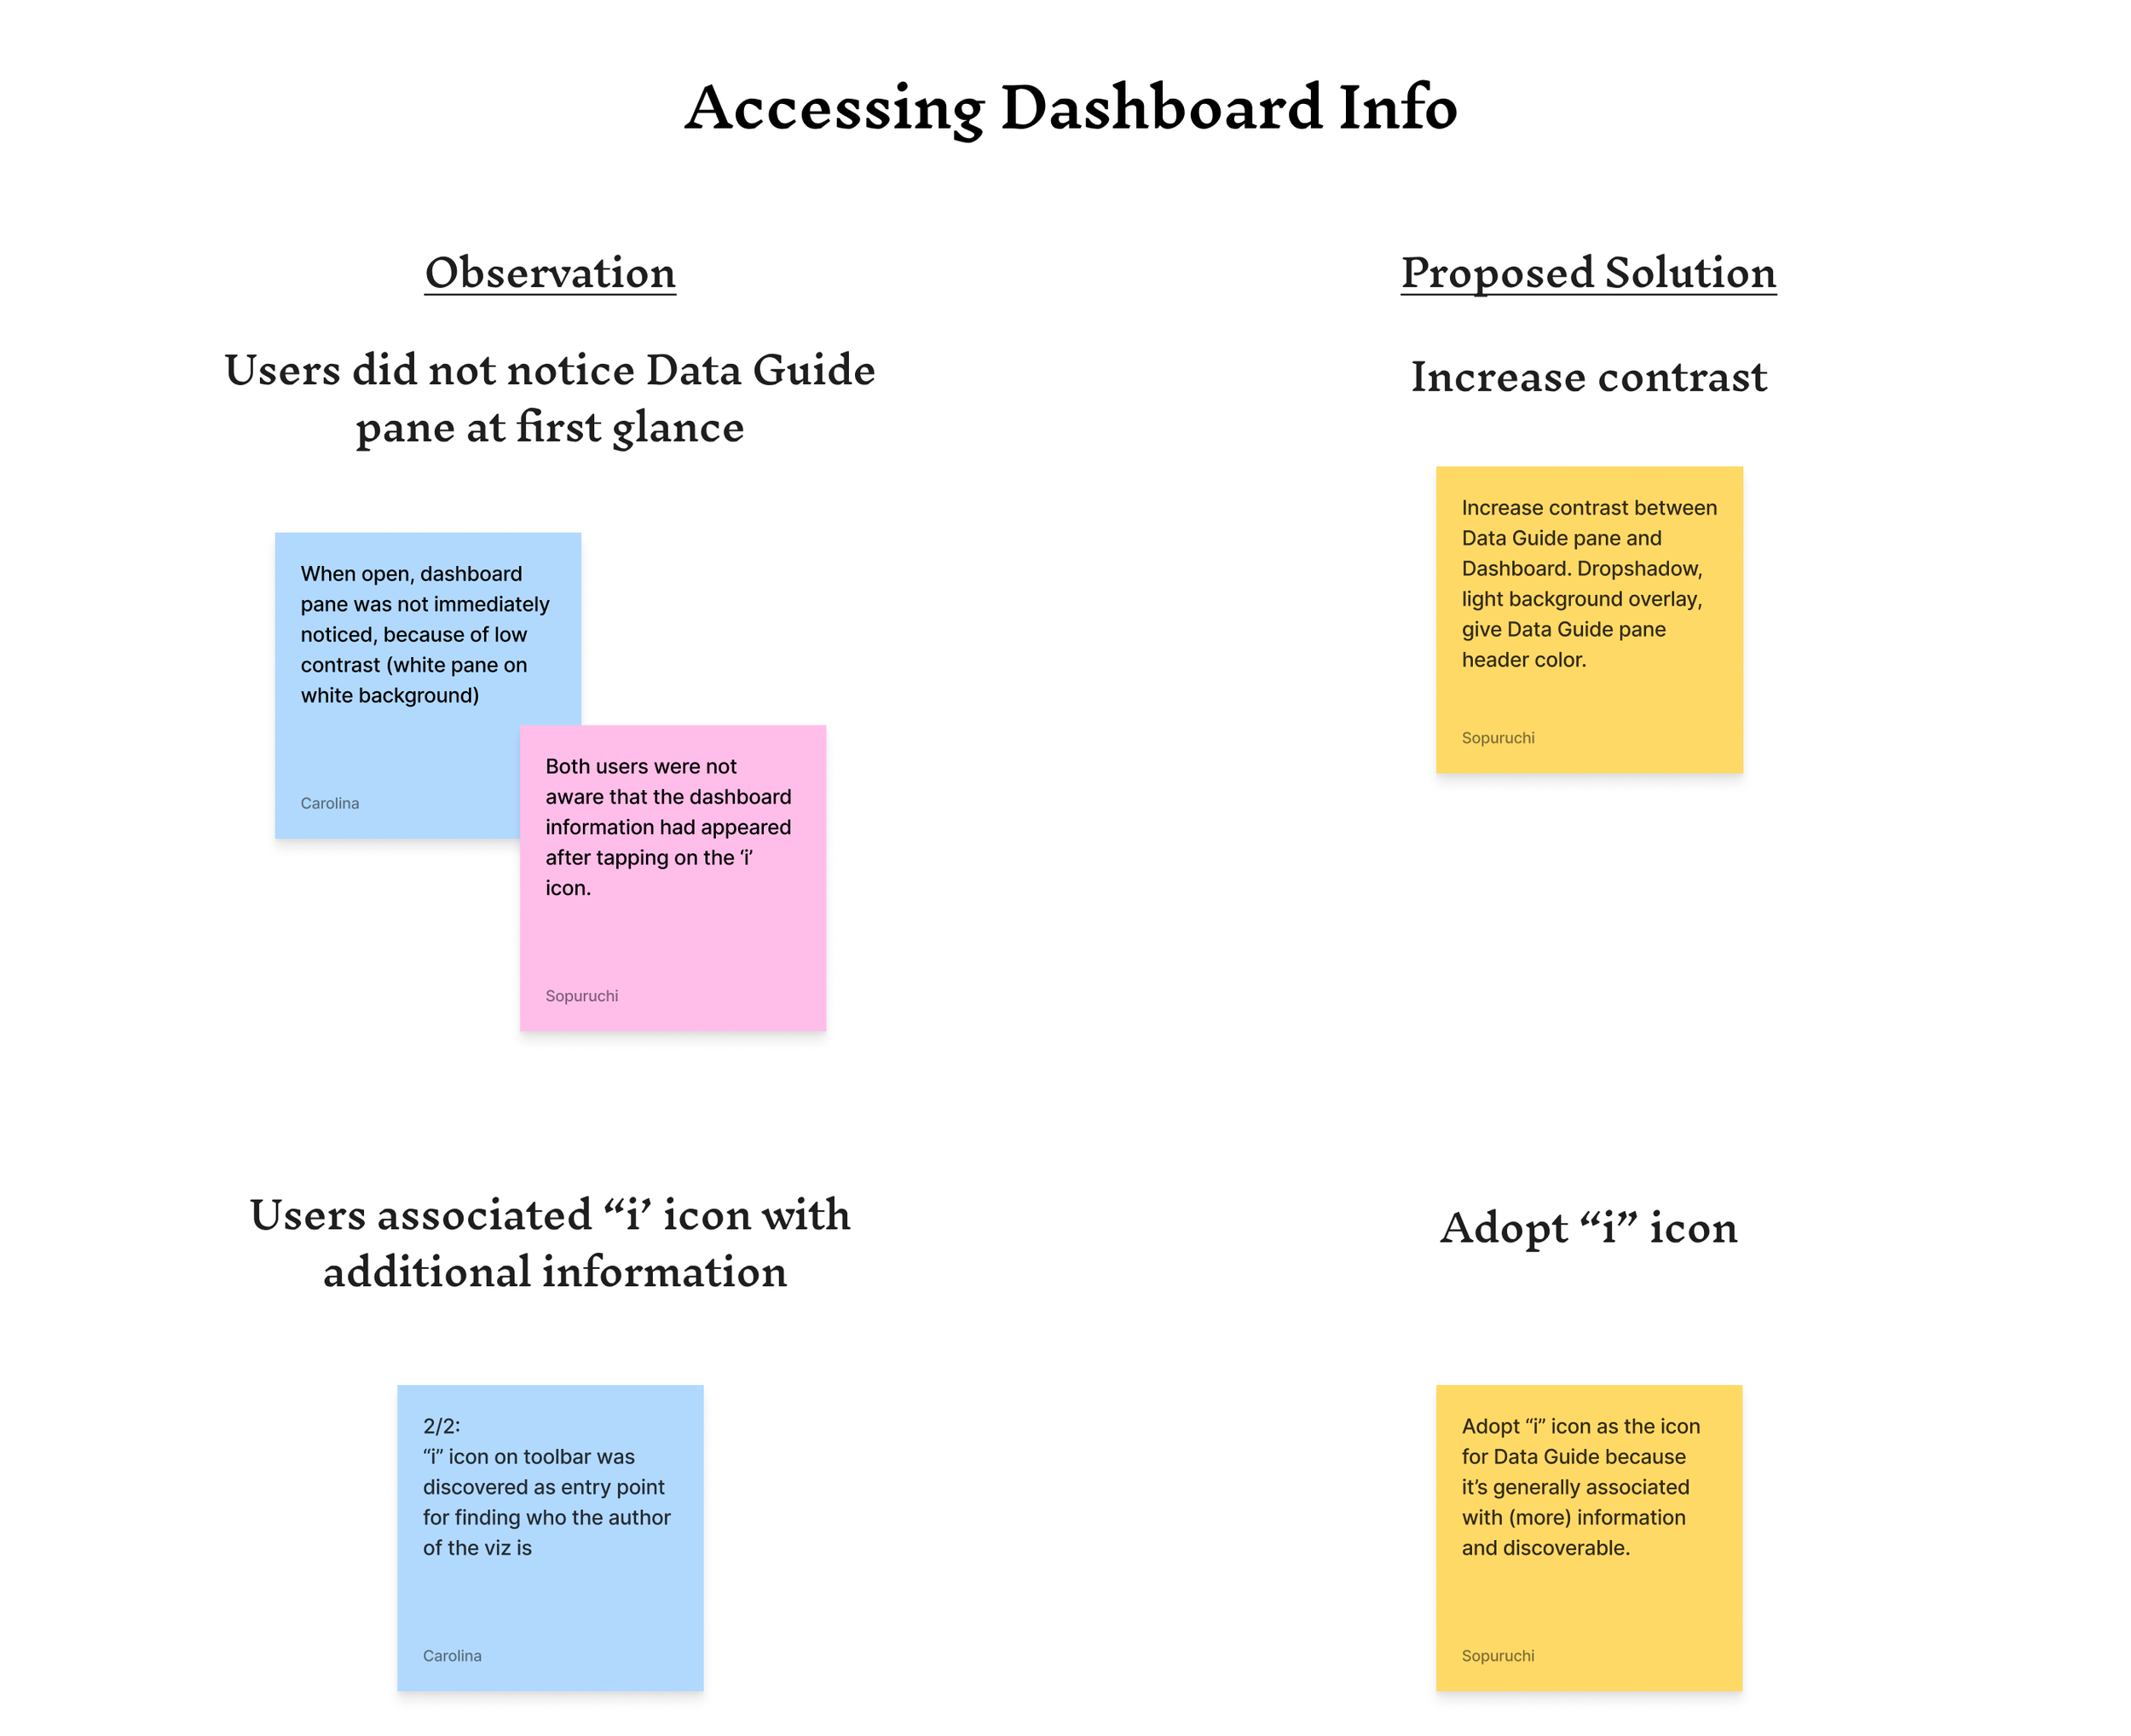
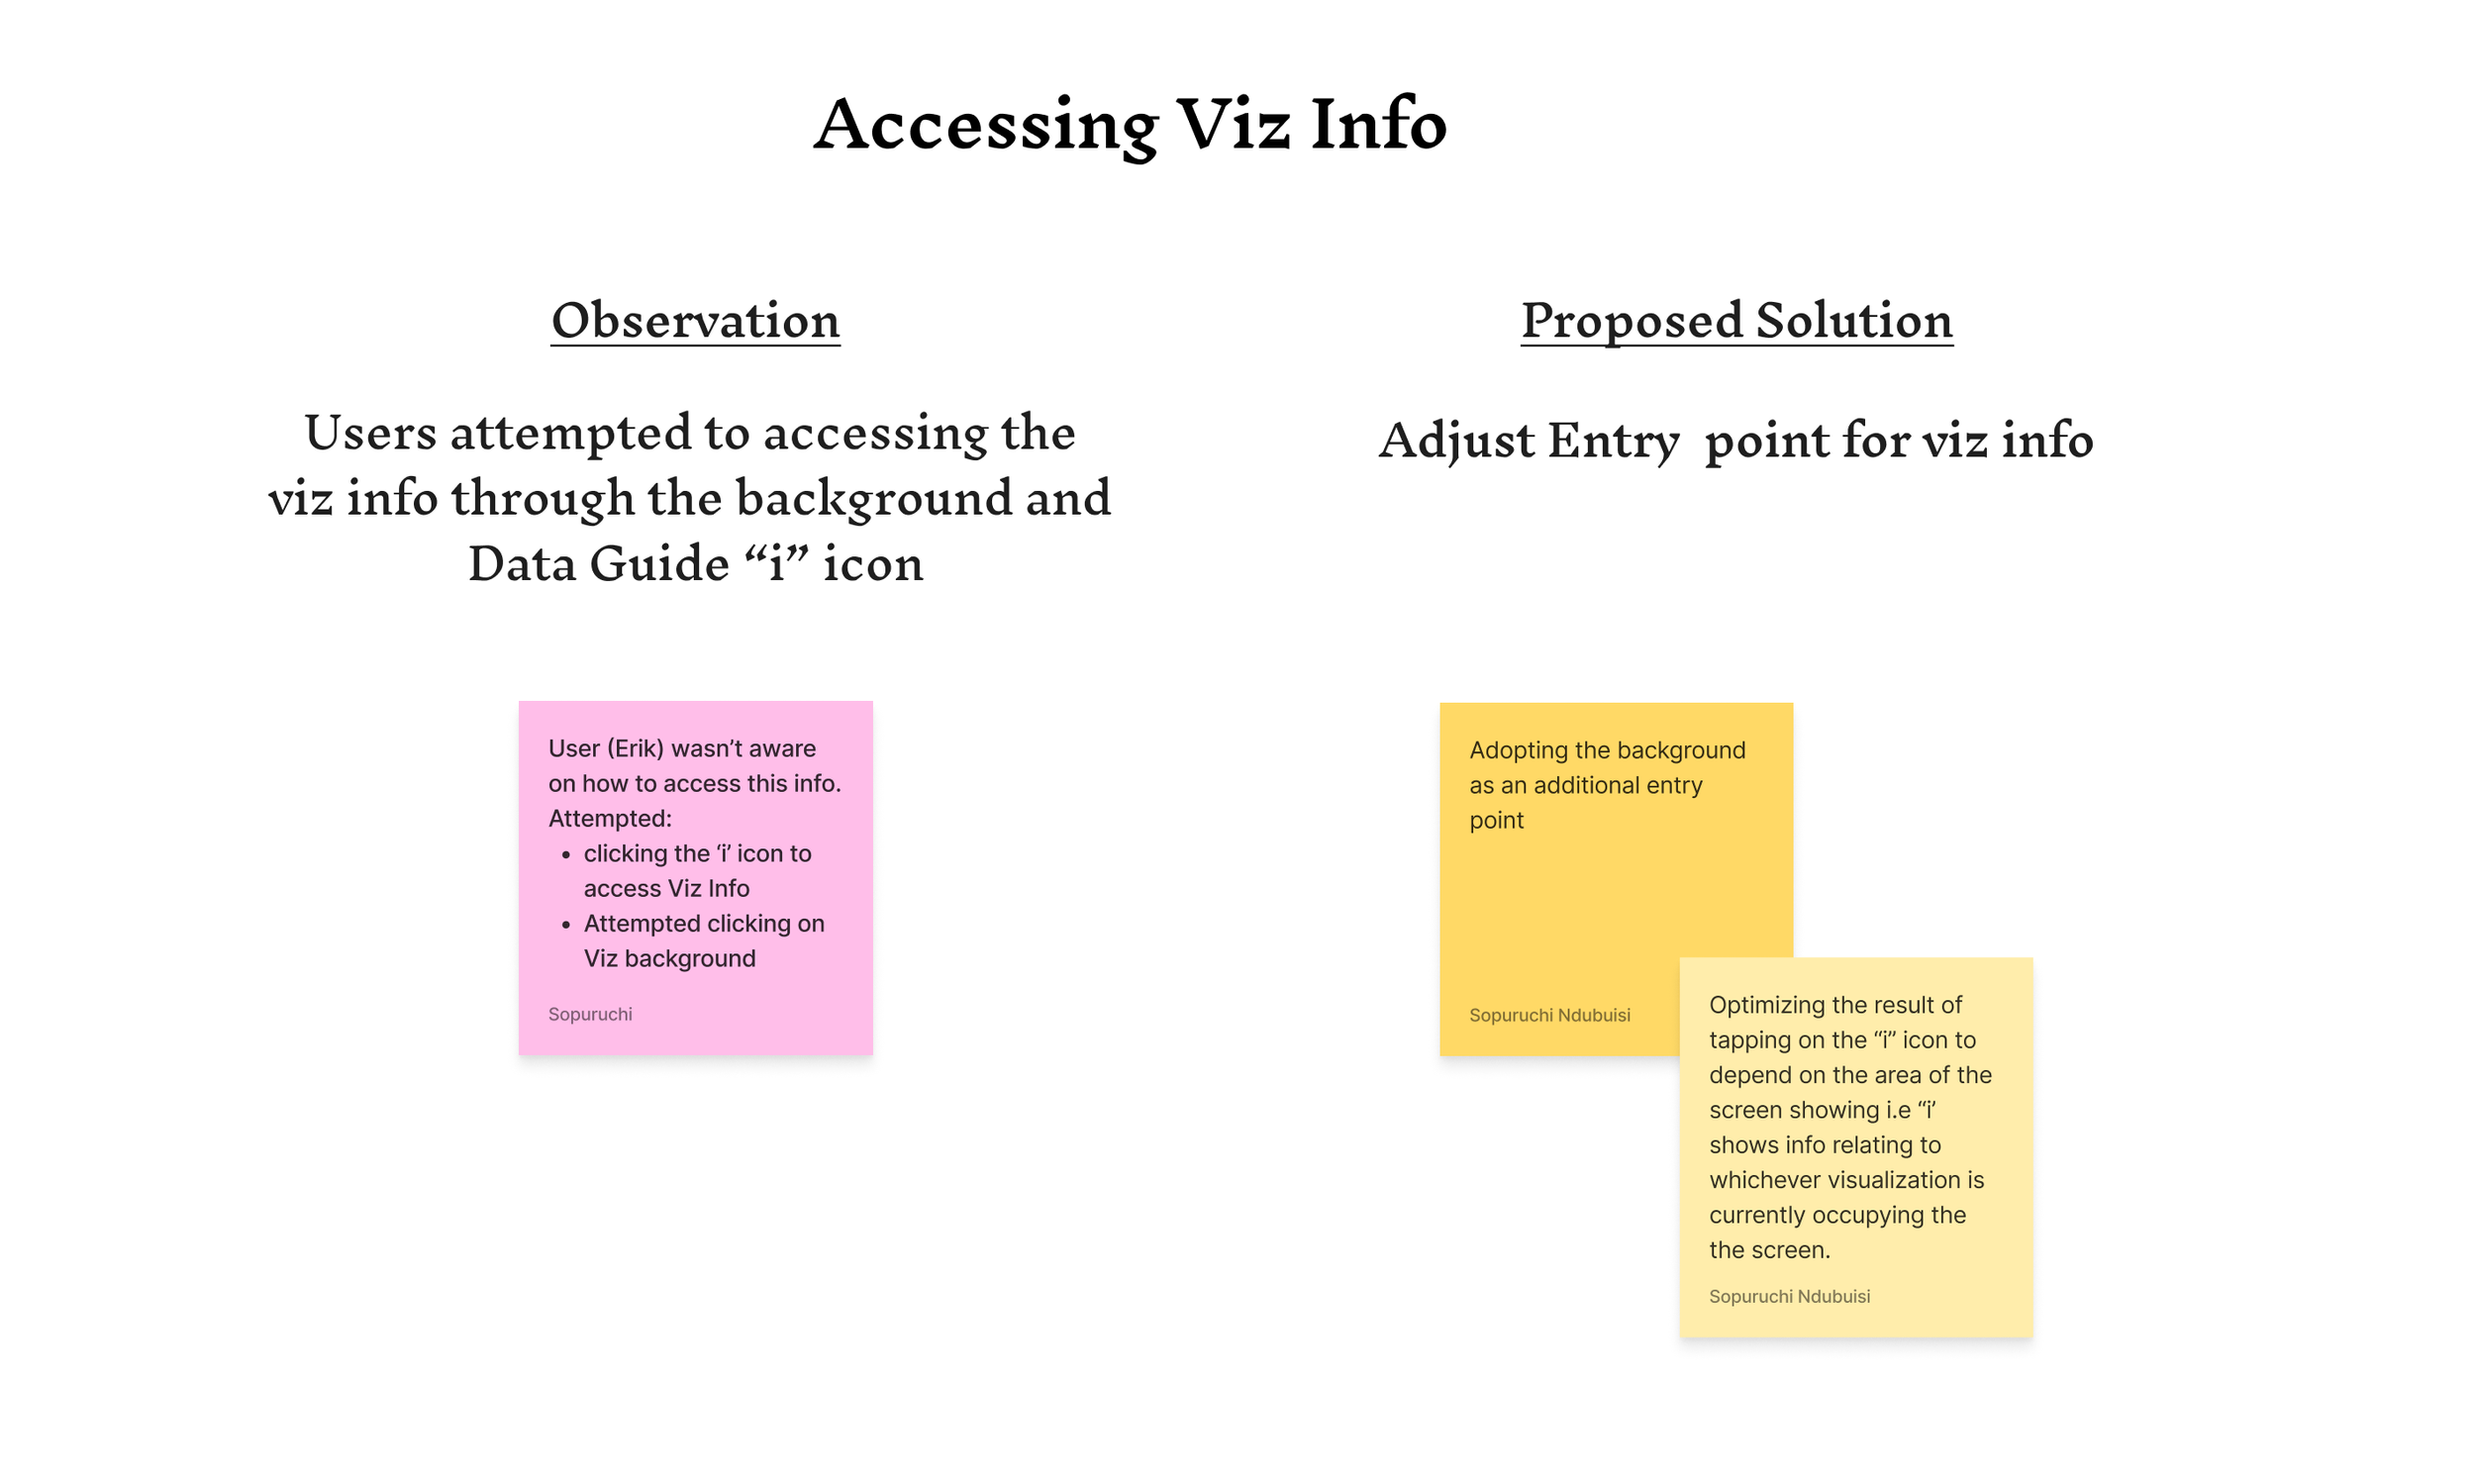
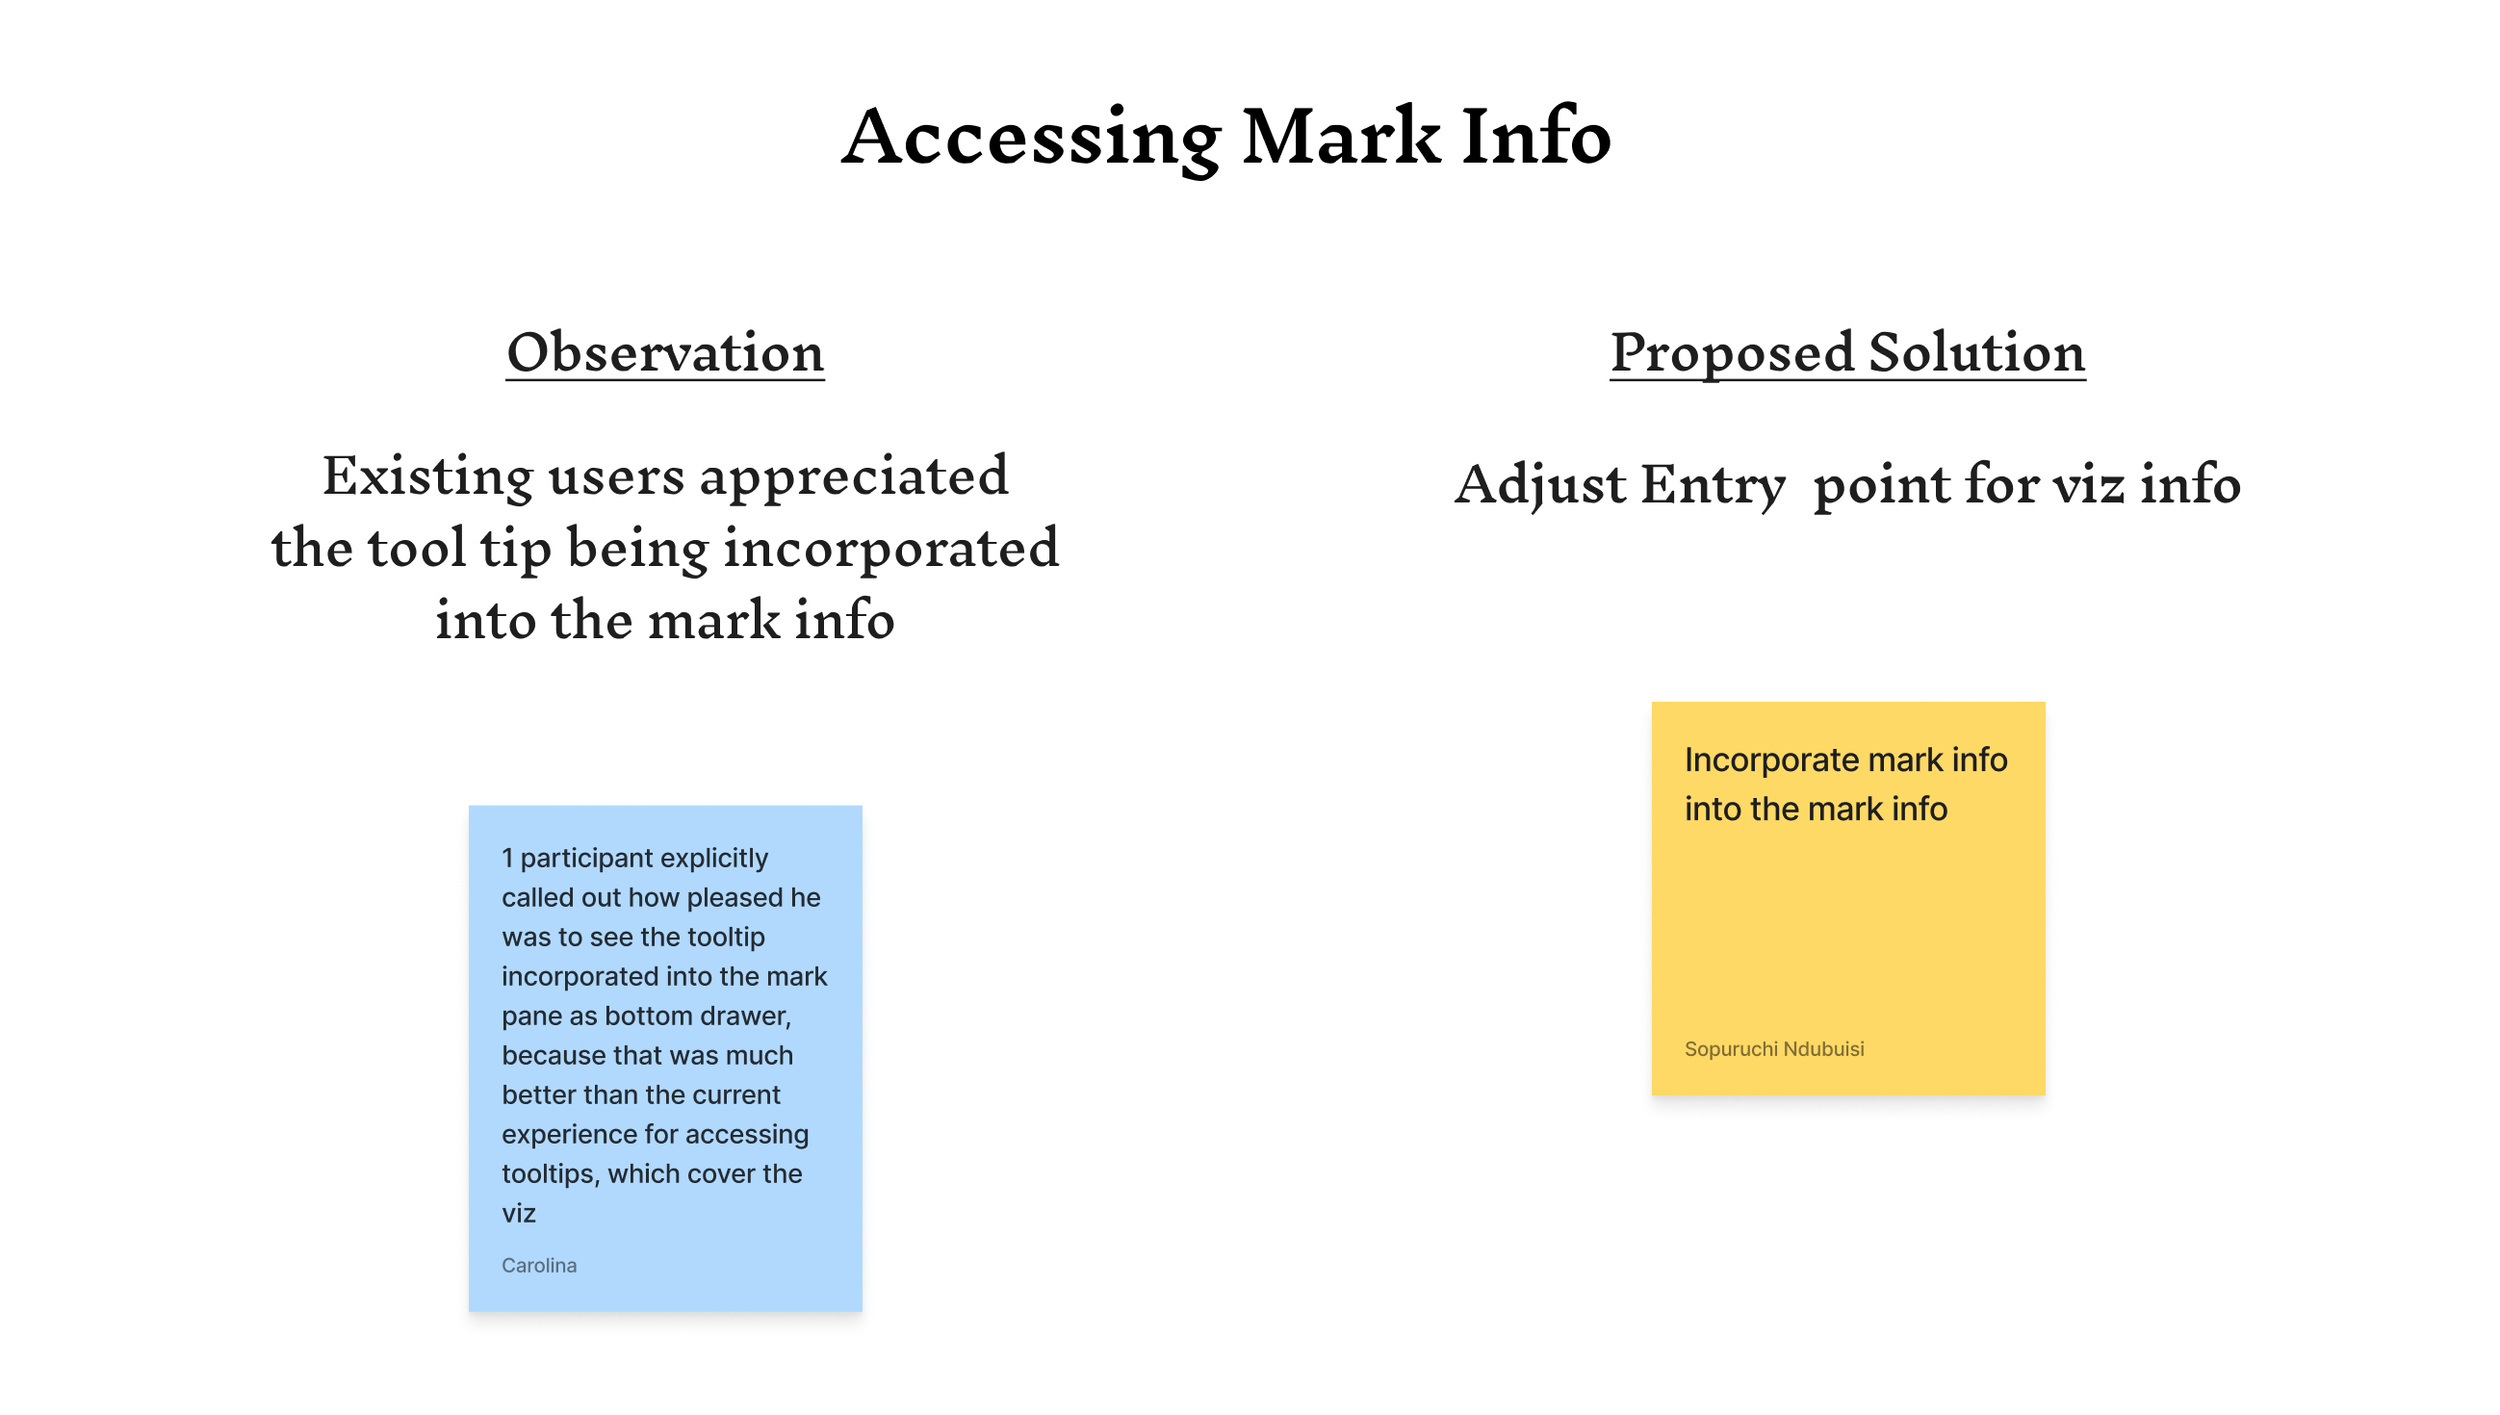
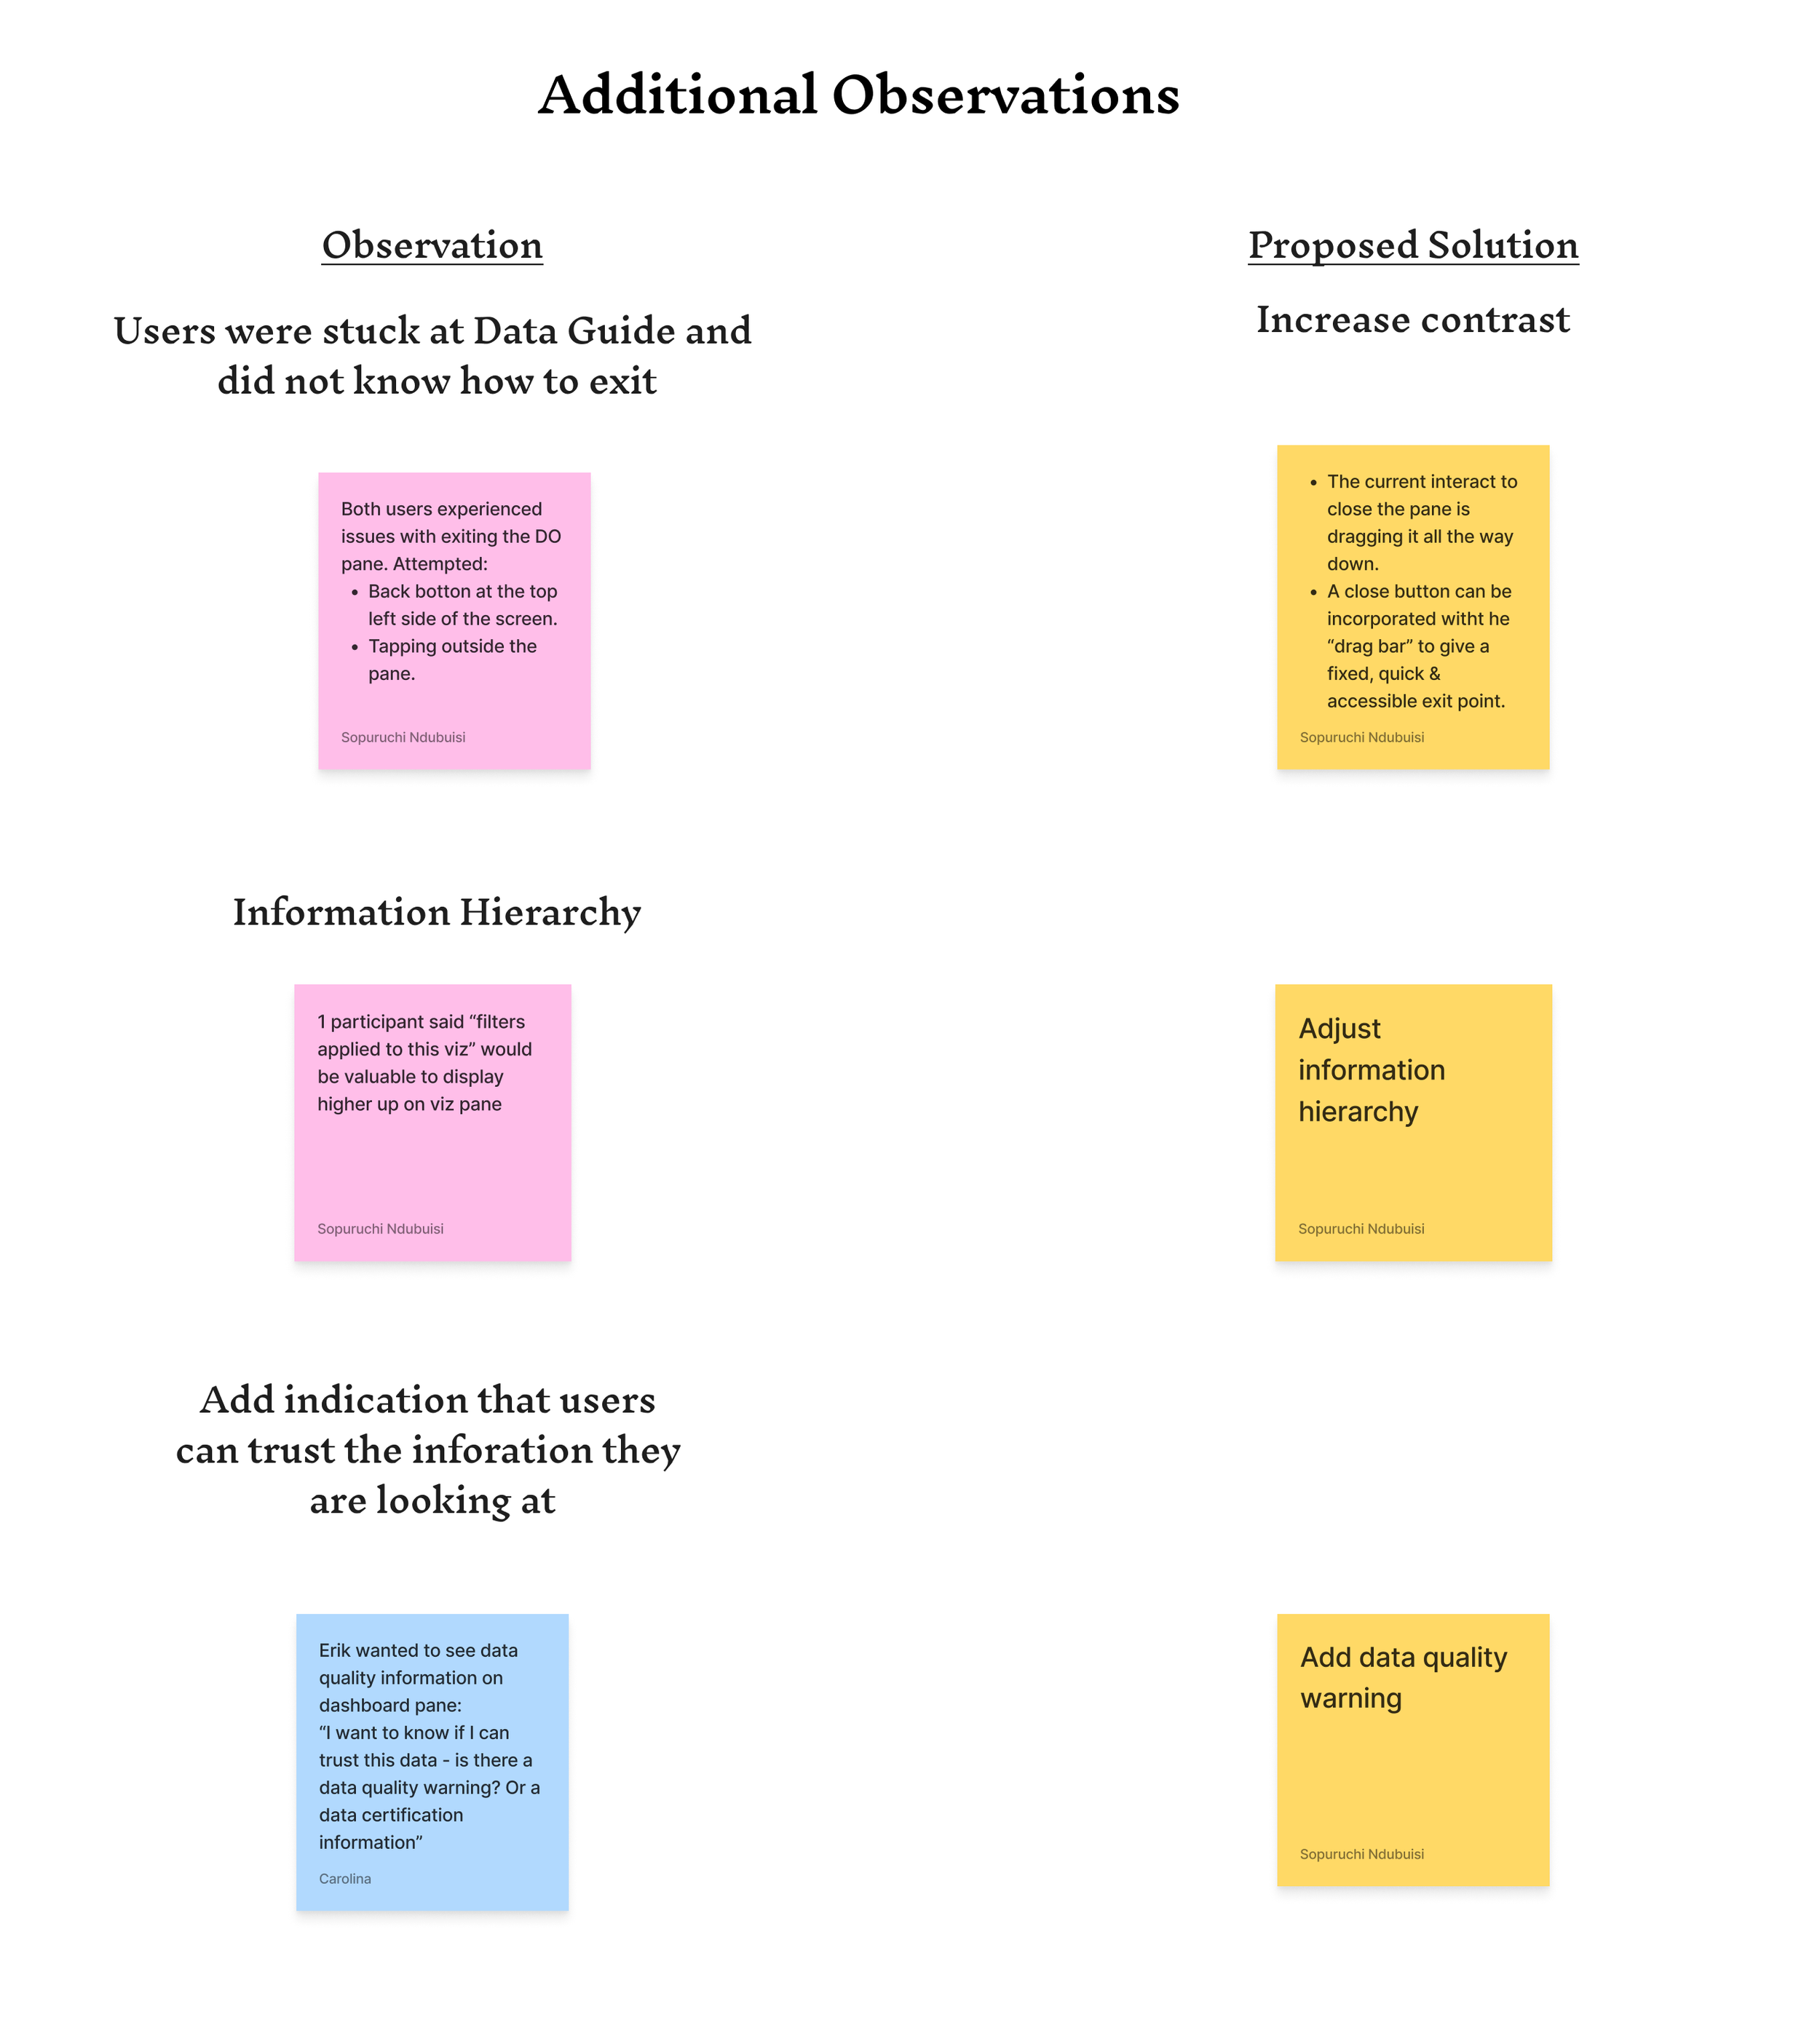
Takeaways
Things I learned
Embrace the unknown
While knowing everything might feel great, the UX process is designed to help you uncover the unknown. When I encountered the hurdle of things I did not know, I learned to embrace them and stay curious, knowing that I am on the right track.
The UX Process is not linear
Prior to my internship, I always saw the UX design process follow the pattern of - User Interviews, Wireframes, Prototypes, and User Testing. However, during my internship, I realized that depending on the stage of a project, the UX design process can look different. I learned it is okay to repeat/revisit steps and leverage resources derived from steps that have been conducted
Constraints push you out of your comfort zone
I had to design around existing systems and some constraints from the technical implementation, this experience pushed me to step out of my comfort zone and think differently than I normally would have.
If I had more time, I would have…
Worked on Visual Design
Design systems are something that I have always found interesting and have been curious about, I would have loved to work on the visual design of this feature while using the Tableau Design Language System as a guide.
Designed for Tablet
Tablet users are similar to mobile users but different in that their devices have more real estate. It would have been interesting to explore what this feature will look like in this case.